How to Use Your Macbook Pro's Sound Card and Audacity as an Oscilloscope
Tags:
Bottom Line: You can use your Macbook Pro’s sound card as an oscilloscope!
Disclaimer
This could possibly be unsafe and result in damage to your computer or your health. I don’t know what I’m doing with electronics, I’m a total beginner, so you probably shouldn’t believe anything I write here without verification from a more credible source. Please see my formal(ish) disclaimer for more info.
Introduction
With that out of the way, I’m super pumped to say that I successfully used my Macbook Pro and a 433 MHz receiver as an oscilloscope to analyze the RF signal from a remote control for these inexpensive outlets. Having done so, I was able to replicate the RF signal and control the outlets programmatically from my Arduino! I imagine it will be equally easy to get them working from my Raspberry Pi, which will probably be the end goal.
An oscilloscope is basically a tool to help you measure voltage over time. Recognizing that many types of electronics communicate with each other essentially by sending “high” and “low” voltage signals in certain sequences and for certain durations of time, the oscilloscope helps us capture and record those signals.
A microphone is basically a device that turns sound waves into electrical signals, which then go to your computer’s sound card for interpretation. Because the sound card is already a device that does a great job with high frequency electrical signals, it’s a great candidate to act as a basic oscilloscope. I had read several posts on how others had used their sound cards as oscilloscopes (sources at the end), but I decided to write my own post on the process because:
- I’ve never heard of anyone doing it on a Macbook Pro.
- I ended up going with a setup that was quite a bit simpler than others have reported (though possibly less safe for that reason).
- I’m amazed that it worked.
Equipment I ended up using:
- 2009 Macbook Pro
- Stereo audio splitter cable
- 1 x 10k Ω resistor
Setup
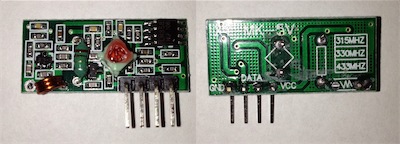
For the project I was interested in, I first purchased a 433 MHz RF receiver (since the outlets I’d purchased used that frequency). Luckily, I scored an affordable kit that also had a transmitter. I used my Arduino just to provide power / ground for the receiver unit, since I didn’t have another 5v power source set up.
Receiver:
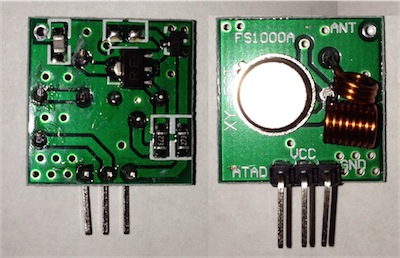
Transmitter:
Once power and ground were wired to the Arduino, I connected a wire to the data pin on the receiver. I connected up my multimeter between this wire and ground, and then powered up the Arduino. Once everything was on, I clicked the button on the RF remote a few times to see how high the voltage was getting up to on the data pin. (Note that there are 2 data pins — I picked one arbitrarily, I’m not sure why there are two.) I planned on connecting this pin to my MBP, and I’ve read that you should have no higher than 1 volt input.
Luckily the voltage was pretty low, but it was hard to tell how low since it just flashed across the screen. So instead, I decided to measure the current through that wire when it was active. I hooked up my multimeter appropriately, and found that it up to about 4 mA whenever I pressed the button.
Then, I tried to remember back to my undergrad physics days to remember Ohm’s Law and how to drop the voltage with a resistor. I figure that while it seemed to be putting out < 1 volt, given that its input voltage was 5v, I could probably use 5v as a theoretical maximum voltage for the calculation. My desired drop in voltage would then be 4v (start at 5, drop to 1) and current is 0.004 amps.
V = IR
R = V/I
R = 4 / 0.004 = 1000 Ω
Hint: The
Ωsymbol isoption zon a Mac
So just to be safe, I took it up an order of magnitude and decided to start with a 10,000 Ω resistor, to see if it worked. If the signal was too low to read, I could always drop the resistance a little. (Spoiler alert: 10k Ω ended up working fine.) I wired the 10k resister in series with the data pin.
For hooking up to the Mac, I used a simple stereo splitter cable:
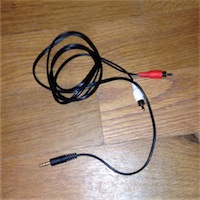
I hooked that into the headphone jack, then went to System Preferences -> Sound -> Input and set it to use the jack as an input device.
So to review, the only connections I needed were:
- 5v power (provided by Arduino)
- Ground (provided by Arduino)
- Data -> 10k Ω resistor —[will connect to stereo cable but not yet]—> stereo cable -> Macbook Pro headphone jack
Next, I needed to set up some way to record the information. While there is an app called iSpectrum that gives more of a traditional oscilloscope display, I elected to use a free / open source audio recording and editing app called Audacity due to some of its more advanced features, which we’ll touch on briefly. If you’re a Homebrew user (if you use even a little command line on OSX you really should be), you can install it through Homebrew Cask brew cask install audacity.
Data collection
In audacity, I opened a new project and made sure to change the sample frequency (bottom left hand corner). I just picked the highest one, figuring the more resolution the better.
Then, I started up the Arduino, picked one of sides of the stereo cable, and connected it to the wire (with the resistor on it) coming from the RF receiver’s data pin. I think either side of the stereo cable will work, it just changes whether it goes to left or right channel.

Finally, I picked up the RF remote and clicked record in Audacity. Once it started recording, I gave it about 2 seconds, then started clicking a button on the remote every couple of seconds. I eventually figured out that it’s smart to try to time the clicks so you know where to look at your recording once you’re all zoomed in (e.g. click at the 2, 4, 6, ad 8 second marks). I stopped recording after a few seconds, then played one of my favorite albums to make sure my sound card wasn’t fried, and zoomed in on the Audacity data. It looks like it was working, so I went ahead and recorded tracks for the other 9 buttons (5 on buttons and 5 off buttons total) in separate channels (by clicking in a blank spot in audacity and hitting record again).
I ended up with something like this:
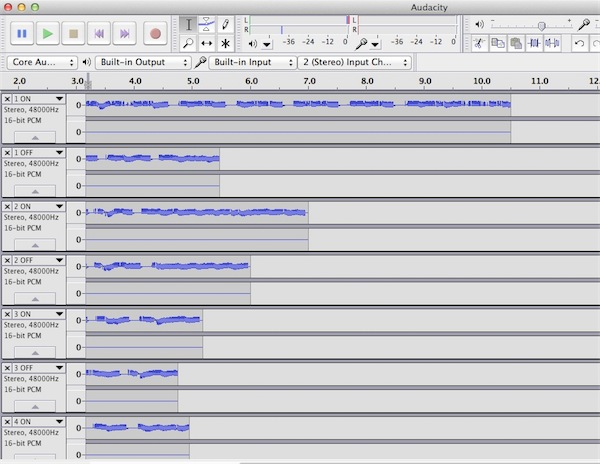
Your first step should be to save the file, and probably make a duplicate. As I’ve tried to emphasize, this process is probably risky to your computer / sound card, so you don’t want to risk losing data and having to do it all over again.
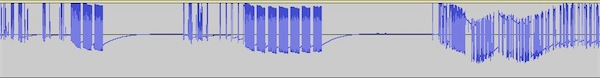
You have to zoom in a bit to see that there is a pattern there. Audacity’s controls are a little weird, but you can use command 1, 2, and 3 to control horizontal (time) zoom, centered around the cursor, and I think command r to “zoom to selection.” Vertical zoom was a little harder to figure out — ends up you have to click over on the left side of the track (cursor will turn to magnifying glass), and it vertically centers the zoom wherever your cursor is, so make sure it’s in the center of your place of interest. It’s something like option click or shift click to vertically zoom out. Eventually, you can get the zoom right and see that there is a clear pattern each time you click the remote. Keep zooming and you’ll get something like this:
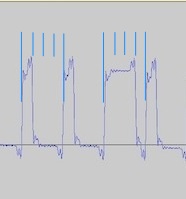
Sets of about 7 pulses of data
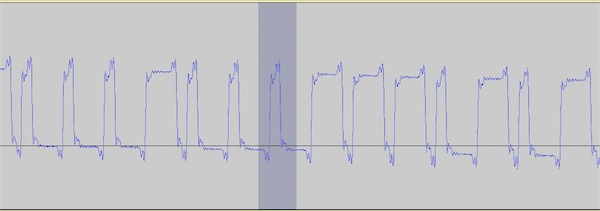
Each of the 7 appears to have a pattern

Appears to be a series of short and long pulses

Short pulses approximately 1/3 the duration of the long pulses, with the short and long lows (pauses) approximately the same duration as the short and long high pulses.
Cool! Now there are a are a few different ways to analyze this data to get your codes. The first step for me was to get the overall pattern.
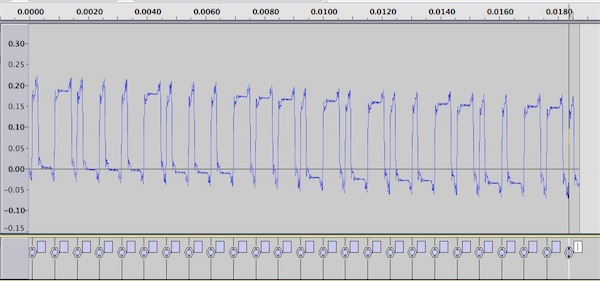
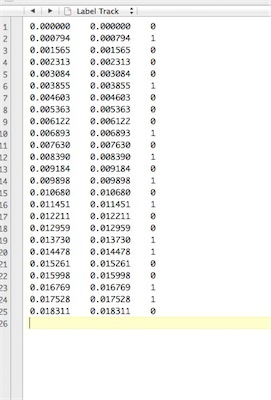
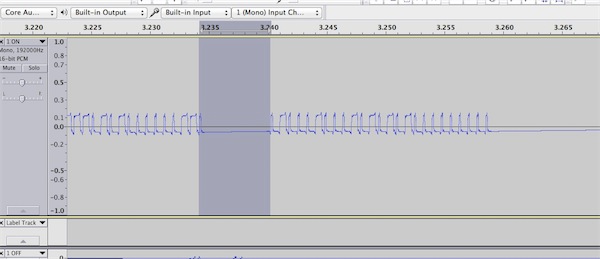
One good way to accomplish this is by using a label track (Tracks -> Add New -> Label Track). This gives you a little track underneath where you can mark timestamps with arbitrary text. The method described in the link above worked well for me — just label long pulses as 1s and short pulses as 0s. Click at the beginning of a pulse, command b is the shortcut to add a label, then input the 0 or 1. You can see my label track in progress below, before I had filled in the 0s and 1s.
Afterward, you can File -> Export Labels and end up with a text file marking the exact times.
The next step is to figure out the durations of the short and long pulses. One way would be to visually estimate that the short pulses are about 1/3 the duration of the long pulses, and pretty much every short pulse appears to be followed by a long pause, and every long pulse by a short pause. Therefore, we should be able to assume that the intervals between all of the starts of the pulses is about the same (short + long == long + short), and that 1/4 of that entire interval is equal to a short pulse, and 3/4 of that entire interval is equal to a long pulse. Hopefully this makes sense.
Based on our label track, the time between the starts of the second and third pulses is 0.001565 - 0.000794 = 0.000771 seconds, or 771 µs. 771 / 4 = 192.75, so based on that, a short pulse is about 192 µs and a long pulse about 578 µs.
Hint: Mac keyboard shortcut for
µiscommand m
Of course I assume the average of all the differences in times would be more accurate than a single one, so I whipped up a quick python script to figure that out for me:
#! /usr/bin/env python3

from statistics import mean

infile = '/Users/n8henrie/Desktop/RF_Arduino_Post/Label Track.txt'

with open(infile) as f:
    cols = [float(col[0].strip()) for col in [line.split('\t') for line in f.readlines()]]

diffs = []
for i in range(len(cols) - 1):
    diffs.append(cols[i + 1] - cols[i])

avg=mean(diffs) * 10**6

output_str = (
              "Mean time between pulse starts: {avg:.5g} µs\n"
              "Average duration of long pulse: {long:.5g} µs\n"
              "Average duration of short pulse: {short:.5g} µs\n\n"
              "All pulses:\n{diffs}"
              .format(avg=avg, long=avg / 4 * 3, short=avg / 4, diffs=diffs)
              )

print(output_str)
And its output:
Mean time between pulse starts: 762.96 µs
Average duration of long pulse: 572.22 µs
Average duration of short pulse: 190.74 µs

All pulses:
[0.000794, 0.000771, 0.000748, 0.000771, 0.000771, 0.0007480000000000004, 0.0007599999999999994, 0.0007590000000000001, 0.000771, 0.0007369999999999998, 0.0007600000000000003, 0.0007939999999999996, 0.0007140000000000011, 0.0007819999999999997, 0.0007709999999999991, 0.0007600000000000003, 0.0007480000000000004, 0.0007709999999999991, 0.0007480000000000004, 0.0007830000000000007, 0.0007369999999999981, 0.0007710000000000009, 0.0007589999999999993, 0.0007830000000000024]
However, this is all predicated on the assumption that there is a 3:1 ratio of the long to short intervals. Because of the possibility that it’s something close to 3:1 but not quite, I was uncomfortable just assuming that the pulse lengths were exactly 3:1. For that reason, I also wanted to show how you can also directly measure the interval lengths by zooming way in, highlighting a segment, displaying Length -> Samples down bottom, and doing some math.
For example,
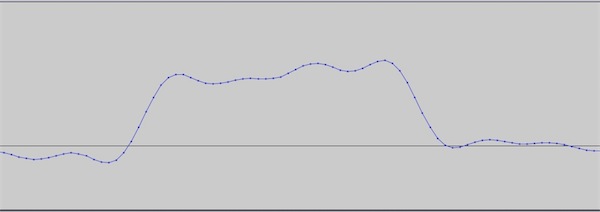
Picking out a short pulse
Zooming in
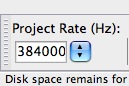
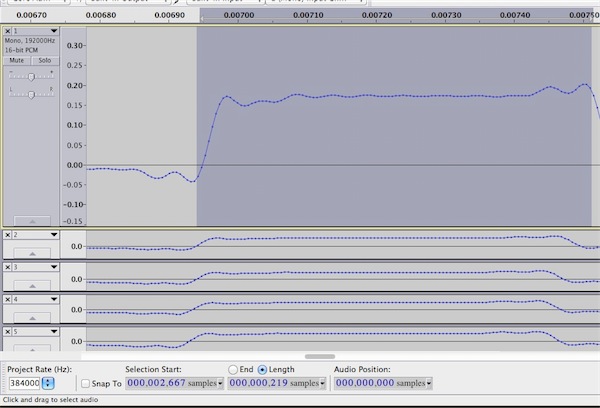
Highlighting — note the Project Rate of 384000 and Length of 73 samples down below
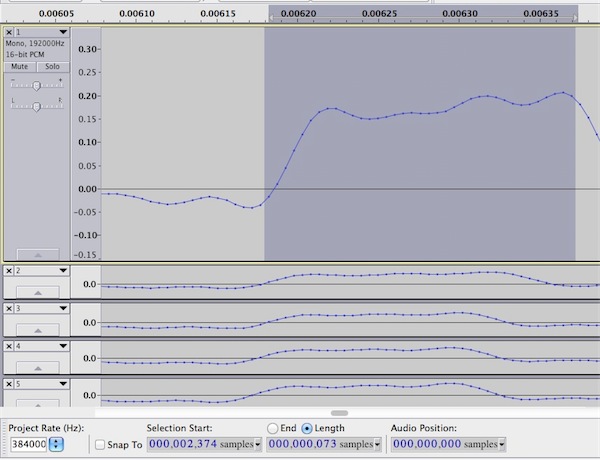
73 samples at 384000 samples per second yields 190 µs duration
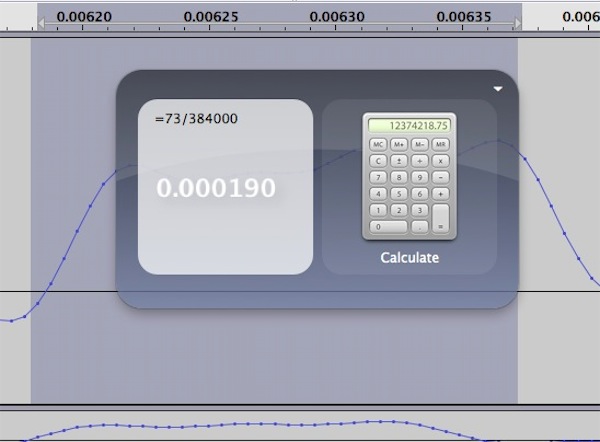
The measured short pulse duration is exactly what we had calculated based off the label track. Note where I started and stopped measuring — I figure I want to capture the signal from the moment it goes high to the instant it is turned off, which in my mind means from the time is starts increasing to the time it starts decreasing. Therefore, I chose to measure from the first sample that was clearly above baseline to the time it was clearly decreasing. It definitely helps expand the window vertically and zoom in.
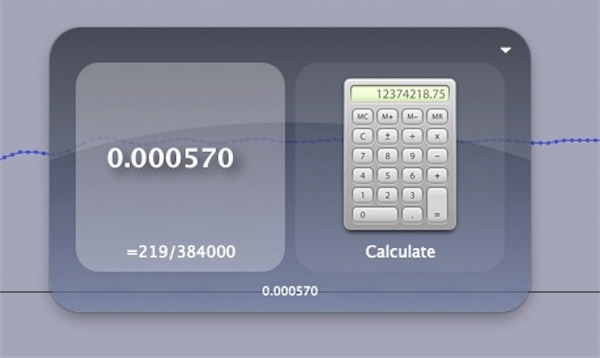
Repeat this process for the long pulses, and we find that we were very close:
Finally, the last thing we need to do is measure the long pause after the last pulse in each set.
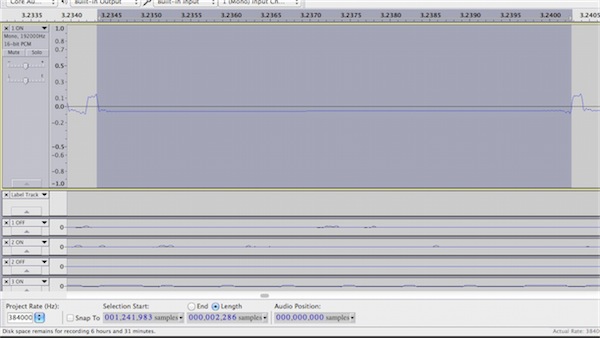
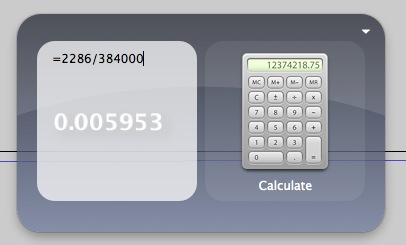
5953 is about 31 short pulses, or a little over 7 “total cycle” durations (4 * short pulse).
Summary
Okay, well that’s about as far as I got on the capturing and analysis side. Luckily, I found this to be the hardest and most time consuming part. I’ll have a followup post in the next day or two that shows how I used this information in Arduino code to programmatically toggle my remote controlled outlets, as well as an Arduino library that takes virtually all the work out of this.
In summary:
- I powered a 433 MHz receiver with my Arduino and connected its data pin through a resistor to a stereo input cable on my Macbook.
- I recorded button clicks in Audacity at a high sample rate.
- After saving the file, I zoomed in and found that each button click produced 7 iterations of a pattern of high and low pulses
- The high pulses were about 570 µs in duration with 190 µs pauses, and the short pulses were about 190 µs in duration with 570 µs pauses.
- At the end of each iteration was a 5953 µs pause.